How To Get Application Specific Metrics Using Express Gateway
Unless you’re building a proof of concept or an application that’s not aiming to reach the production, you definitely want to add monitoring and metrics to your system. In this installment we’re going to look how Express-Gateway can help you to add application specific metrics and expose them through an HTTP endpoint that can be queried by an external service, such as Prometheus.
Express Gateway to Rescue
Express Gateway is an API Gateway that sits at the heart of any microservices architecture. Regardless of what language or platform you’re using, it secures different microservices and exposes them through APIs using Node.js, ExpressJS, and Express.js middleware.
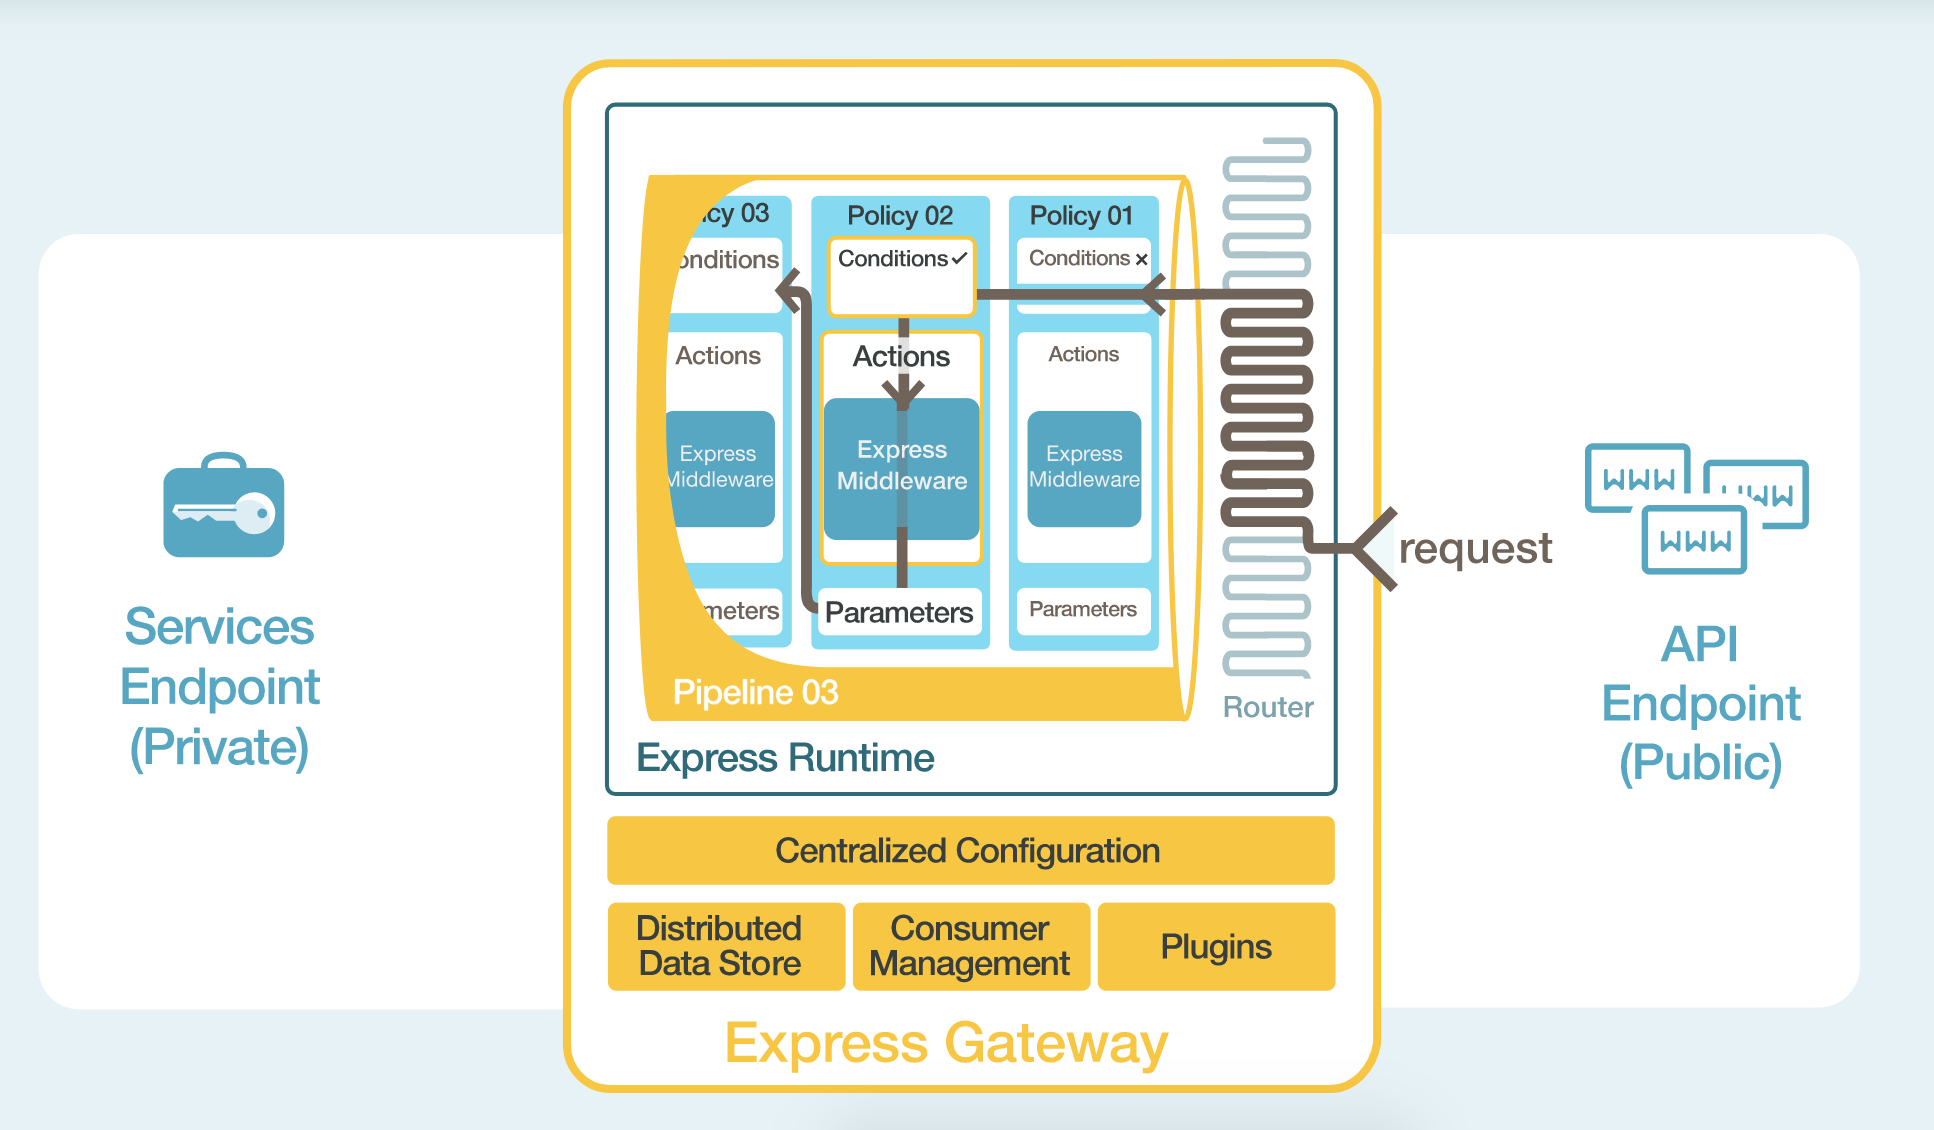
Express Gateway centralizes all the application configuration for the API use case into one YAML (or JSON) file. Within the YAML file there is an easy to understand description of how and what is configured.
Express Gateway entities, like policies, pipelines, conditions, and actions, wrap around Express.js middleware to make it dynamic. Therefore, any Express.js middleware can be plugged into Express Gateway to take advantage of its dynamic capabilities. It also features a hot-reload mechanism so you can change its configuration without having to restart the Gateway.
Writing a Plugin for Express Gateway
Express Gateway comes with a plugin framework used to extend the Express Gateway core.
The plugin framework enables anyone to take Express.js middleware and integrate it into Express Gateway as a plugin. Express Gateway provides a declarative way to take advantage of Express.js middleware to be driven centrally and executed dynamically.
We’re going to leverage this framework in order to build a plugin that hooks our HTTP responses and then collects the information we need.
Scaffolding a Plugin
A plugin is nothing more than a Javascript object that you export. It’s shape is described in detail here.
module.exports = {
  init: function (pluginContext) {

  },
}
In our example, the plugin will:
-
Expose a policy that hooks in the response, collecting information in Prometheus format.
-
Extend the Admin API to expose an additional endpoint which serves the collected information.
What metrics are we going to collect?
There are a lot of ways to slice and dice metrics. They may vary according to your needs.
In this example, we will label all the responses that are on the way to the client according to:
-
Success/Failed responses (discerned on the status code)
-
The status code itself
-
The consumer id (if the request is authenticated)
-
The API Endpoint that triggered the Gateway
What format do we expose the metrics?
In order to leverage the existing tooling around, we will expose the collected metrics in the Prometheus Text Based Wire Format. In this way, we can leverage the tools that are already on the space to push and visualize the informations, such as Grafana.
const metrics = require('prom-client');

const statusCodeCounter = new metrics.Counter({
  name: 'status_codes',
  help: 'status_code_counter',
  labelNames: ['type', 'status_code', 'consumer', 'apiendpoint']
});

module.exports = {
  version: '1.0.0',
  policies: ['metrics'],
  init: function (pluginContext) {
    pluginContext.registerAdminRoute((app) => {
      app.get(pluginContext.settings.endpointName, (req, res) => {
        if (req.accepts(metrics.register.contentType)) {
          res.contentType(metrics.register.contentType);
          return res.send(metrics.register.metrics());
        }

        return res.json(metrics.register.getMetricsAsJSON());
      });
    });

    pluginContext.registerPolicy({
      name: 'metrics',
      policy: ({ consumerIdHeaderName }) => (req, res, next) => {
        res.once('finish', () => {
          const apiEndpoint = req.egContext.apiEndpoint.apiEndpointName;
          const consumerHeader = req.header(consumerIdHeaderName) || 'anonymous';
          const statusCode = res.statusCode.toString();
          const responseType = res.statusCode >= 200 && res.statusCode < 300 ? 'SUCCESS' : 'FAILED';
          statusCodeCounter.labels(responseType, statusCode, consumerHeader, apiEndpoint).inc();
        });

        next();
      }
    });
  }
};
Let’s go through the code and see the relevant parts:
const statusCodeCounter = new metrics.Counter({
  name: 'status_codes',
  help: 'status_code_counter',
  labelNames: ['type', 'status_code', 'consumer', 'apiendpoint']
});
Here we’re declaring a new Prometheus Counter called status_code that will track all the responses and categorize
them based on the declared labels: ['type', 'status_code', 'consumer', 'apiendpoint']
pluginContext.registerAdminRoute((app) => {
  app.get(pluginContext.settings.endpointName, (req, res) => {
    if (req.accepts(metrics.register.contentType)) {
      res.contentType(metrics.register.contentType);
      return res.send(metrics.register.metrics());
    }
    return res.json(metrics.register.getMetricsAsJSON());
  });
});
In part of code, it is registering a new route that will expose all the collected metrics. According to the Accept header, we’re either returning the data in Prometheus format as JSON or in Text format. The external tool collecting the data (such as InfluxDB or a Prometheus server) will query this endpoint periodically to grab the latest updates.
Note: Prometheus also supports data pushing instead of pulling it periodically. This allows you to avoid exposing an endpoint at all. Based on your requirements (i.e. security) you may opt for this option.
pluginContext.registerPolicy({
  name: 'metrics',
  policy: ({ consumerIdHeaderName }) => (req, res, next) => {
    res.once('finish', () => {
      const apiEndpoint = req.egContext.apiEndpoint.apiEndpointName;
      const consumerHeader = req.header(consumerIdHeaderName) || 'anonymous';
      const statusCode = res.statusCode.toString();
      const responseType = res.statusCode >= 200 && res.statusCode < 300 ? 'SUCCESS' : 'FAILED';
      statusCodeCounter.labels(responseType, statusCode, consumerHeader, apiEndpoint).inc();
    });

    next();
  }
});
Then we export a new policy which will register an event handler once the response is terminated. So, now we can inspect all the response as well as request details that will populate our labels.
Note: egContext is an Express Gateway specific object that contains additional information on a request that’s being handled.
Moving On
Metrics are hard. In a microservices context, it’s even harder. In our next post, we’ll put it all together in production with a real-time example and sample data so stay tuned!
More Resources
- Join the community on our Gitter channel
- Learn more about upcoming features and releases by checking out the Express Gateway Roadmap